Visualizing TensorFlow Graphs with TensorBoard

How does it work?
TensorBoard helps engineers to analyze, visualize, and debug TensorFlow graphs. This tutorial will help you to get started with TensorBoard, demonstrating some of its capabilities.
Visualizing a graph and plot metrics about its execution does not happen automatically in TensorBoard. After you add a number of functions to your source code, TensorFlow will write events related to the execution of your graph to a special folder. To get started with TensorBoard, you also need to point it to the folder with these events.
The EVENTS, IMAGES, GRAPH, and HISTOGRAMS tabs in the upper right corner of TensorBoard represent the types of data that you can collect during graph execution.
Launching TensorBoard
Let’s try an example that demonstrates TensorFlow debugging features using the softmax regression algorithm.
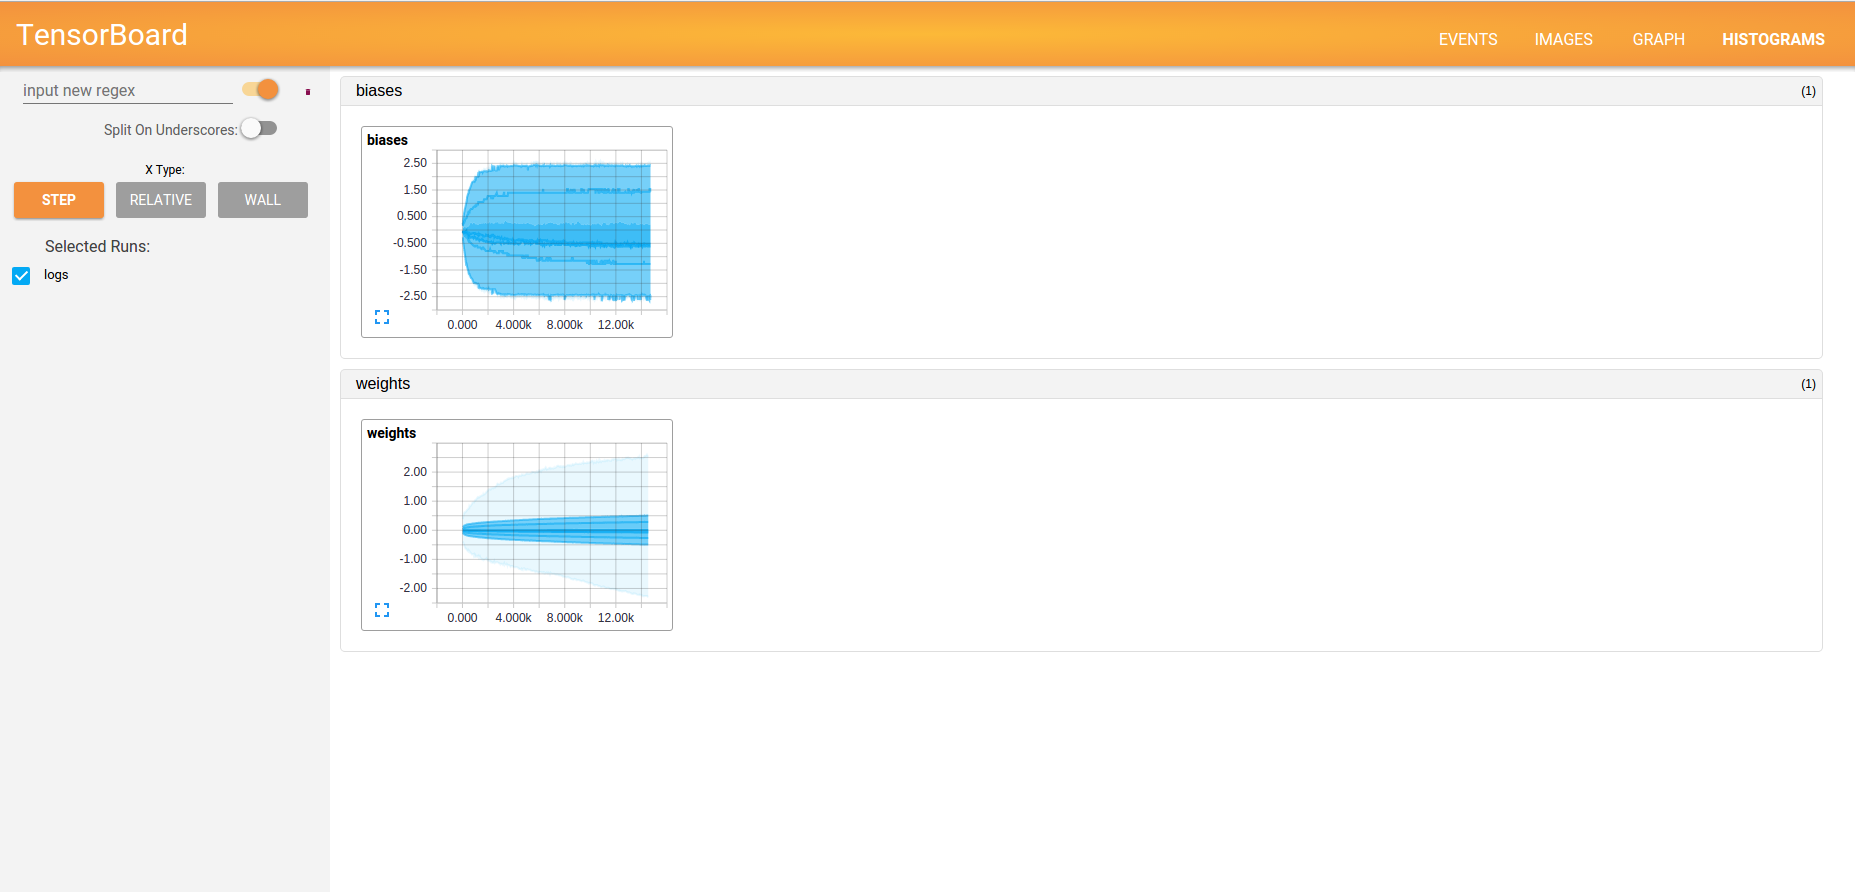
To collect data about a particular node of a TensorFlow graph, you can refer to one of the summary operations. For example, if you want to visualize the distribution of weights or biases, you should use the histogram_summary operation.
with tf.name_scope("Wx_b") as scope:
    # Construct a linear model
    model = tf.nn.softmax(tf.matmul(x, W) + b) # Softmax

# Add summary ops to collect data
w_h = tf.histogram_summary("weights", W)
b_h = tf.histogram_summary("biases", b)
Below, you will find its representation on the HISTOGRAMS tab.
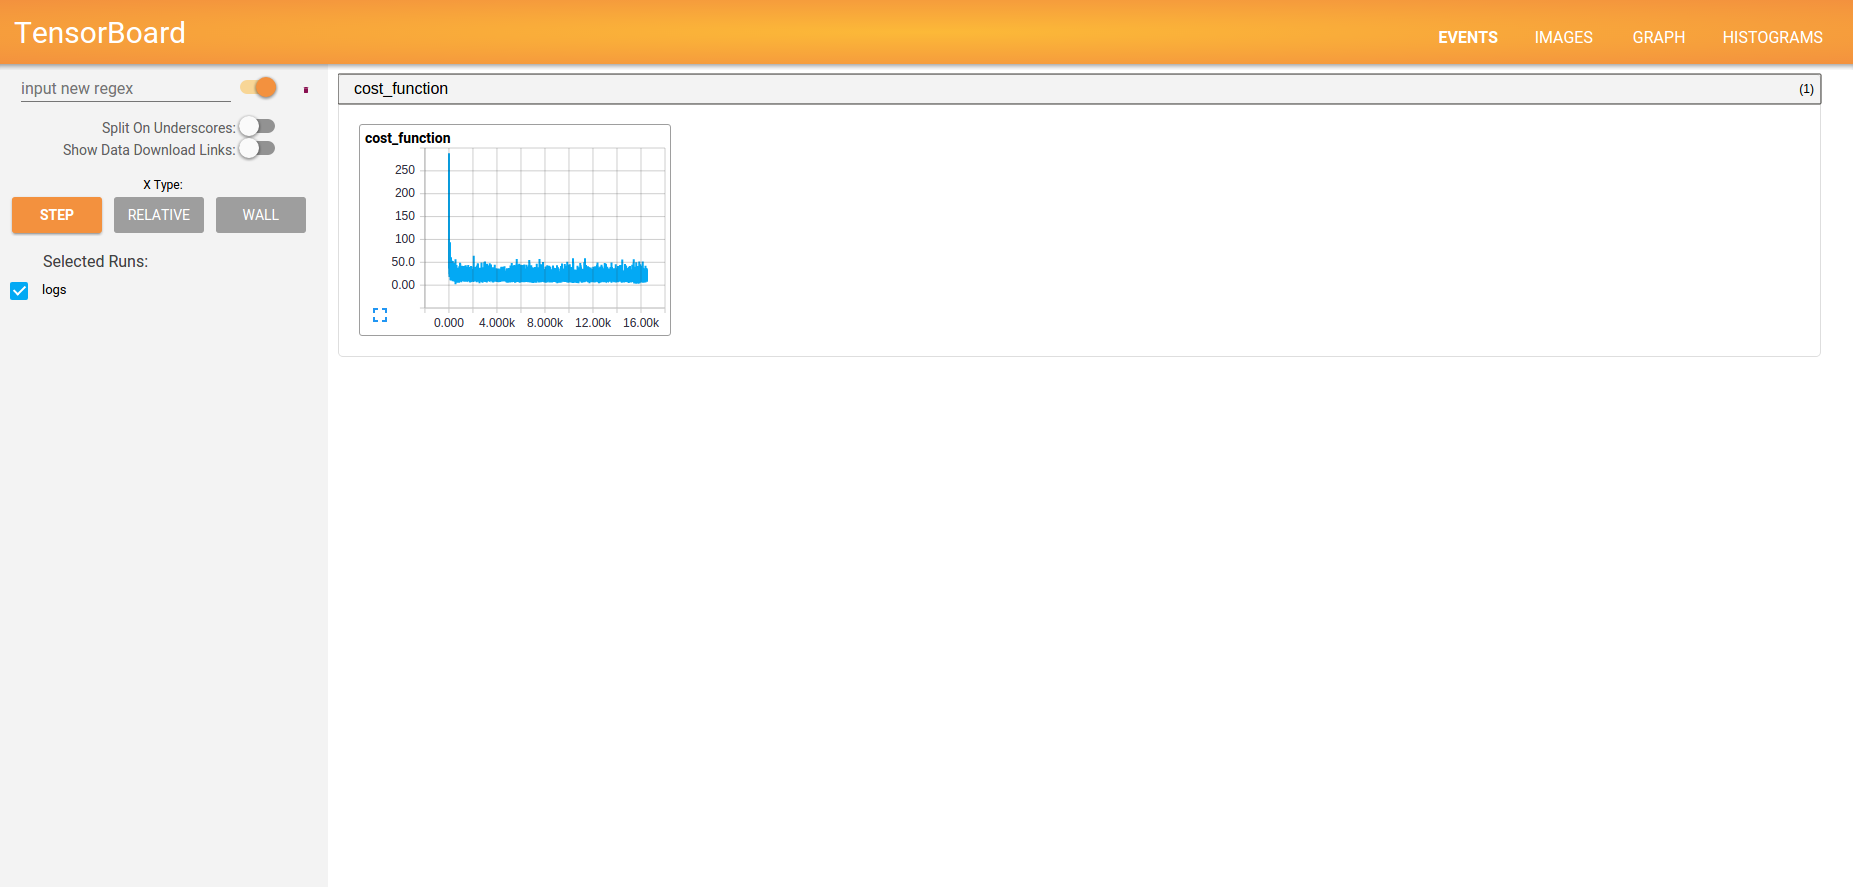
For visualization of the cost function, we can use the scalar_summary operation.
with tf.name_scope("cost_function") as scope:
    # Minimize error using cross entropy
    # Cross entropy
    cost_function = -tf.reduce_sum(y*tf.log(model))
    # Create a summary to monitor the cost function
    tf.scalar_summary("cost_function", cost_function)
Find its representation on the EVENTS tab below.
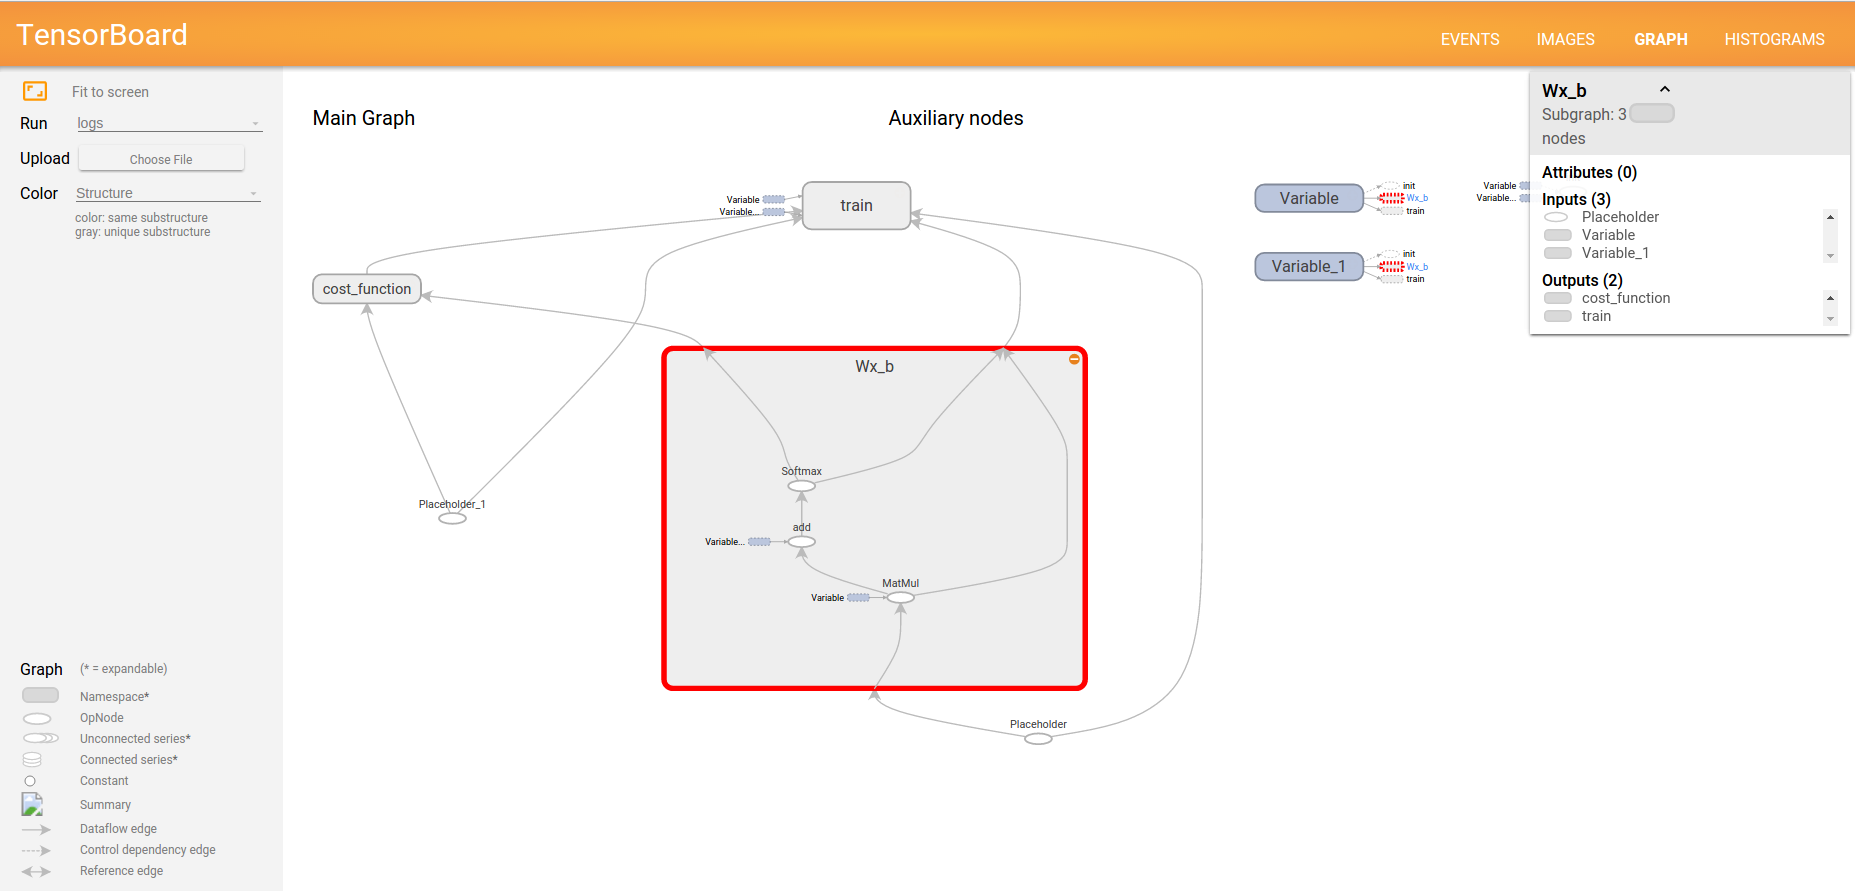
To see the graph, click the GRAPH tab on the top panel. If your graph has thousands of nodes, visualizing it on a single view is hard. To make the visualization more convenient, we can organize logically related operations into groups using tf.name_scope with specific names like Wx_b or cost_function.
with tf.name_scope("Wx_b") as scope:
    # Construct a linear model
    model = tf.nn.softmax(tf.matmul(x, W) + b) # Softmax
or
with tf.name_scope("cost_function") as scope:
    # Minimize error using cross entropy
    # Cross entropy
    cost_function = -tf.reduce_sum(y*tf.log(model))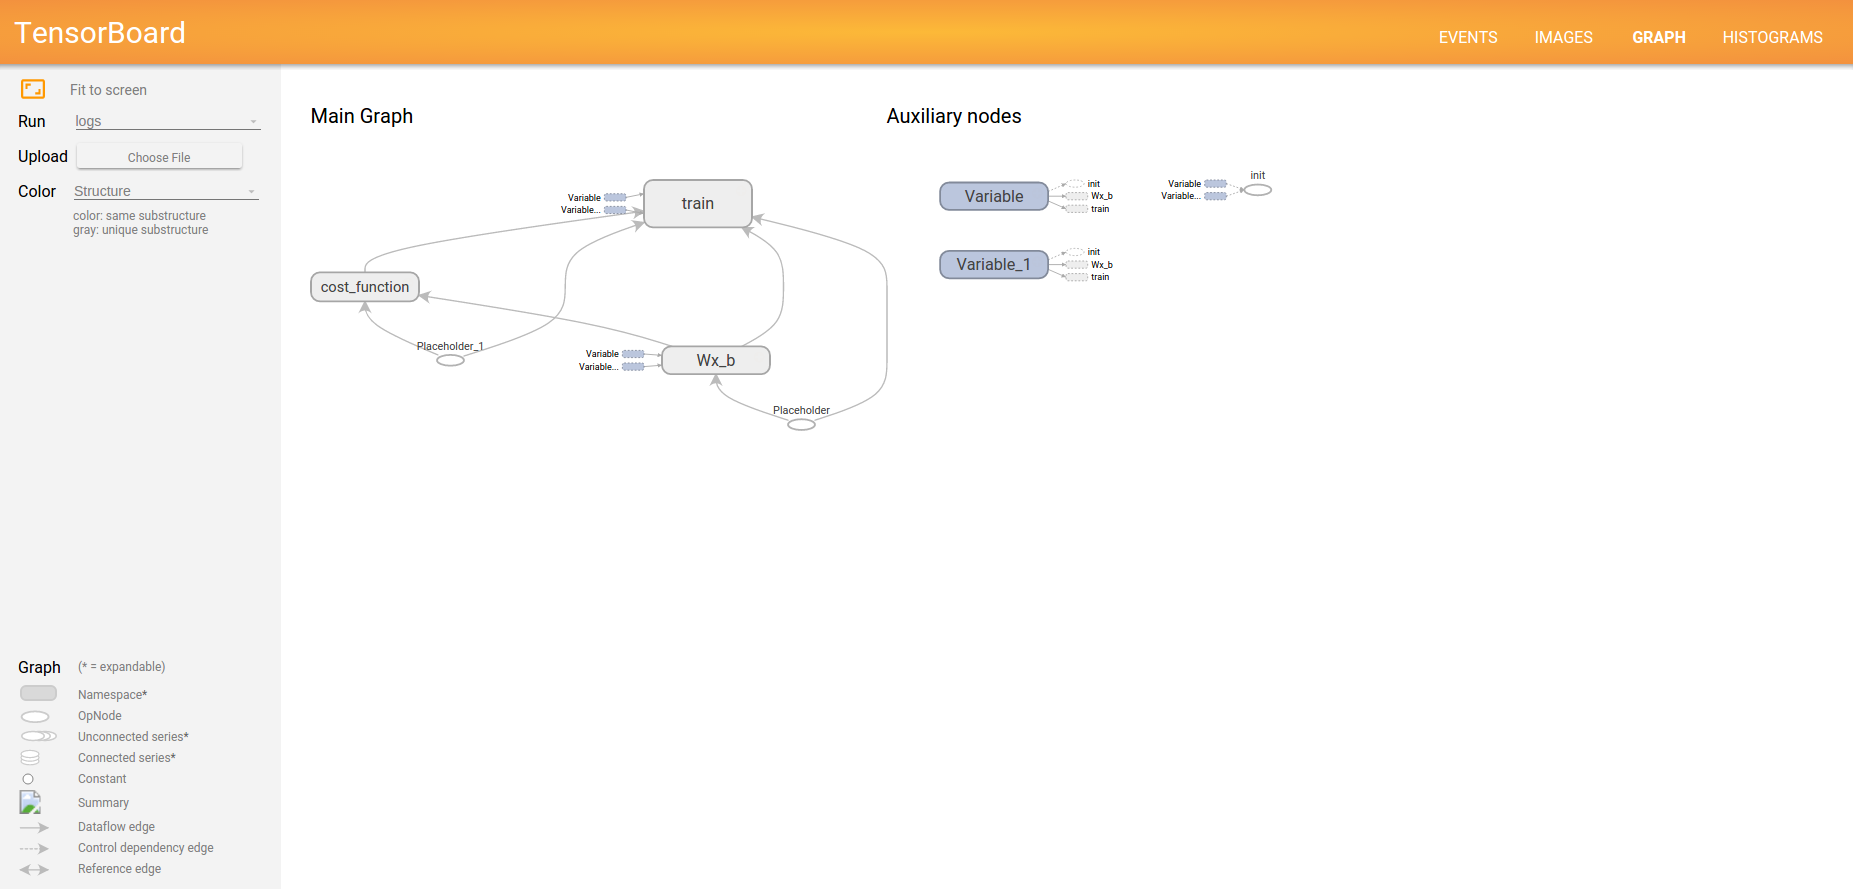
By default, only the top of the nodes hierarchy is shown. We can click on an operation group, and it will be expanded. For example, let’s click on the Wx_b group:
Now, let’s combine all summary operations into a single operation with tf.merge_all_summaries.
# Merge all summaries into a single operator
merged_summary_op = tf.merge_all_summaries()
Then, define a folder for storing workflow events using the command below.
# Set the logs writer to the folder /tmp/tensorflow_logs
summary_writer = tf.train.SummaryWriter('/home/sergo/work/logs',graph_def=sess.graph_def)
After this, write an operations summary for each iteration.
summary_str = sess.run(merged_summary_op, feed_dict={x: batch_xs, y: batch_ys})
summary_writer.add_summary(summary_str, iteration*total_batch + i)
Launch TensorBoard with the command below.
tensorboard --logdir=/home/sergo/work/logs
Source code
You can find the source code of the example below.
# Import MNIST data
import input_data
mnist = input_data.read_data_sets("/tmp/data/", one_hot=True)

import tensorflow as tf

# Set parameters
learning_rate = 0.01
training_iteration = 30
batch_size = 100
display_step = 2

# TF graph input
x = tf.placeholder("float", [None, 784]) # mnist data image of shape 28*28=784
y = tf.placeholder("float", [None, 10]) # 0-9 digits recognition => 10 classes

# Create a model

# Set model weights
W = tf.Variable(tf.zeros([784, 10]))
b = tf.Variable(tf.zeros([10]))

with tf.name_scope("Wx_b") as scope:
    # Construct a linear model
    model = tf.nn.softmax(tf.matmul(x, W) + b) # Softmax

# Add summary ops to collect data
w_h = tf.histogram_summary("weights", W)
b_h = tf.histogram_summary("biases", b)

# More name scopes will clean up graph representation
with tf.name_scope("cost_function") as scope:
    # Minimize error using cross entropy
    # Cross entropy
    cost_function = -tf.reduce_sum(y*tf.log(model))
    # Create a summary to monitor the cost function
    tf.scalar_summary("cost_function", cost_function)

with tf.name_scope("train") as scope:
    # Gradient descent
    optimizer = tf.train.GradientDescentOptimizer(learning_rate).minimize(cost_function)

# Initializing the variables
init = tf.initialize_all_variables()

# Merge all summaries into a single operator
merged_summary_op = tf.merge_all_summaries()

# Launch the graph
with tf.Session() as sess:
    sess.run(init)

    # Set the logs writer to the folder /tmp/tensorflow_logs
    summary_writer = tf.train.SummaryWriter('/home/sergo/work/logs', graph_def=sess.graph_def)

    # Training cycle
    for iteration in range(training_iteration):
        avg_cost = 0.
        total_batch = int(mnist.train.num_examples/batch_size)
        # Loop over all batches
        for i in range(total_batch):
            batch_xs, batch_ys = mnist.train.next_batch(batch_size)
            # Fit training using batch data
            sess.run(optimizer, feed_dict={x: batch_xs, y: batch_ys})
            # Compute the average loss
            avg_cost += sess.run(cost_function, feed_dict={x: batch_xs, y: batch_ys})/total_batch
            # Write logs for each iteration
            summary_str = sess.run(merged_summary_op, feed_dict={x: batch_xs, y: batch_ys})
            summary_writer.add_summary(summary_str, iteration*total_batch + i)
        # Display logs per iteration step
        if iteration % display_step == 0:
            print "Iteration:", '%04d' % (iteration + 1), "cost=", "{:.9f}".format(avg_cost)

    print "Tuning completed!"

    # Test the model
    predictions = tf.equal(tf.argmax(model, 1), tf.argmax(y, 1))
    # Calculate accuracy
    accuracy = tf.reduce_mean(tf.cast(predictions, "float"))
    print "Accuracy:", accuracy.eval({x: mnist.test.images, y: mnist.test.labels})
In brief, TensorBoard works with TensorFlow events files to visualize a graph and information related to its execution. To generate the necessary data, you can use TensorFlow summary operations.
Want more? Watch the video!
In this session, Rebecca Murphy of Ocado Technology explains what TensorBoard is and how to use it for visualizing learning.
Further reading
- Basic Concepts and Manipulations with TensorFlow
- Using Linear Regression in TensorFlow
- Using Logistic and Softmax Regression in TensorFlow