Implementing k-means Clustering with TensorFlow

In data science, cluster analysis (or clustering) is an unsupervised-learning method that can help to understand the nature of data by grouping information with similar characteristics. The clusters of data can then be used for creating hypotheses on classifying the data set. The k-means algorithm is one of the clustering methods that proved to be very effective for the purpose.
This step-by-step guide explains how to implement k-means cluster analysis with TensorFlow.
Create a clustering model
First, let’s generate random data points with a uniform distribution and assign them to a 2D-tensor constant. Then, randomly choose initial centroids from the set of data points.
points = tf.constant(np.random.uniform(0, 10, (points_n, 2)))
centroids = tf.Variable(tf.slice(tf.random_shuffle(points), [0, 0], [clusters_n, -1]))
For the next step, we want to be able to do element-wise subtraction of points and centroids that are 2D tensors. As the tensors have different shape, let’s expand points and centroids into three dimensions, which enables us to use the broadcasting feature of subtraction operation.
points_expanded = tf.expand_dims(points, 0)
centroids_expanded = tf.expand_dims(centroids, 1)
Then, calculate the distances between points and centroids and determine the cluster assignments.
distances = tf.reduce_sum(tf.square(tf.subtract(points_expanded, centroids_expanded)), 2)
assignments = tf.argmin(distances, 0)
Next, we can compare each cluster with a cluster assignments vector, get points assigned to each cluster, and calculate mean values. These mean values are refined centroids, so let’s update the centroids variable with the new values.
means = []
for c in range(clusters_n):
    means.append(tf.reduce_mean(
      tf.gather(points,
                tf.reshape(
                  tf.where(
                    tf.equal(assignments, c)
                  ),[1,-1])
               ),reduction_indices=[1]))

new_centroids = tf.concat(means, 0)
update_centroids = tf.assign(centroids, new_centroids)
Build clusters and display results
It’s time to run the graph. For each iteration, we update the centroids and return their values along with the cluster assignments values.
with tf.Session() as sess:
  sess.run(init)
  for step in xrange(iteration_n):
    [_, centroid_values, points_values, assignment_values] = sess.run([update_centroids, centroids, points, assignments])
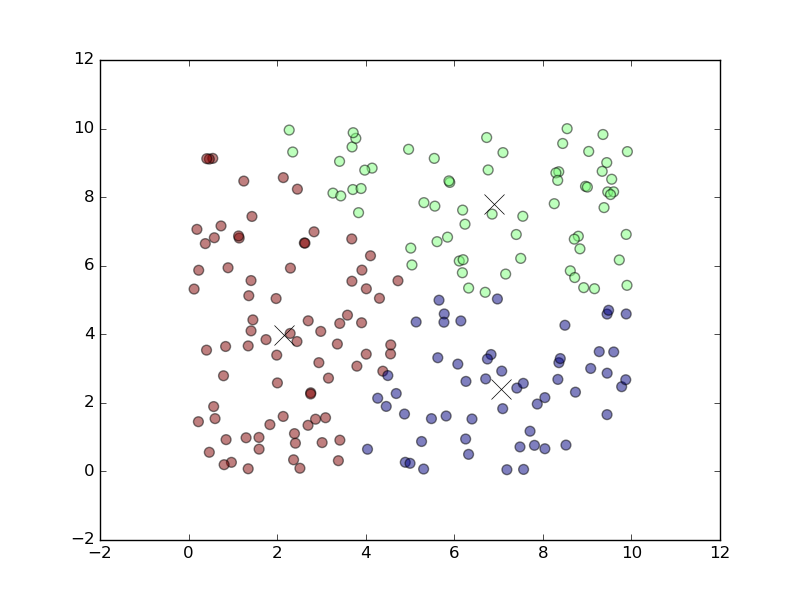
Lastly, we display the coordinates of the final centroids and a multi-colored scatter plot showing how the data points have been clustered.
print("centroids", centroid_values)

plt.scatter(points_values[:, 0], points_values[:, 1], c=assignment_values, s=50, alpha=0.5)
plt.plot(centroid_values[:, 0], centroid_values[:, 1], 'kx', markersize=15)
plt.show()
After running the code, the clusters will be displayed as follows.
 Clusters of data created with k-means
The data in a training set is grouped into clusters as the result of implementing the k-means algorithm with TensorFlow.
The final source code
Here’s the full source code for this example—combined all together.
import matplotlib.pyplot as plt
import numpy as np
import tensorflow as tf

points_n = 200
clusters_n = 3
iteration_n = 100

points = tf.constant(np.random.uniform(0, 10, (points_n, 2)))
centroids = tf.Variable(tf.slice(tf.random_shuffle(points), [0, 0], [clusters_n, -1]))

points_expanded = tf.expand_dims(points, 0)
centroids_expanded = tf.expand_dims(centroids, 1)

distances = tf.reduce_sum(tf.square(tf.subtract(points_expanded, centroids_expanded)), 2)
assignments = tf.argmin(distances, 0)

means = []
for c in range(clusters_n):
    means.append(tf.reduce_mean(
      tf.gather(points,
                tf.reshape(
                  tf.where(
                    tf.equal(assignments, c)
                  ),[1,-1])
               ),reduction_indices=[1]))

new_centroids = tf.concat(means, 0)

update_centroids = tf.assign(centroids, new_centroids)
init = tf.global_variables_initializer()

with tf.Session() as sess:
  sess.run(init)
  for step in range(iteration_n):
    [_, centroid_values, points_values, assignment_values] = sess.run([update_centroids, centroids, points, assignments])

  print("centroids", centroid_values)

plt.scatter(points_values[:, 0], points_values[:, 1], c=assignment_values, s=50, alpha=0.5)
plt.plot(centroid_values[:, 0], centroid_values[:, 1], 'kx', markersize=15)
plt.show()
This is one of the many clustering methods available. While we presented one of the basic scenarios, other approaches exist for identifying centroids and ways to shape clusters (e.g., hierarchical clustering).
Check out the links below for tutorials on other algorithms that can be implemented with TensorFlow or attend our training to get practical skills with machine learning.
Further reading
- Basic Concepts and Manipulations with TensorFlow
- Visualizing TensorFlow Graphs with TensorBoard
- Using Linear Regression with TensorFlow
- Using Logistic and Softmax Regression with TensorFlow
with assistance from Sophia Turol.


