How to Remotely Debug Cloud Foundry Apps


When using Cloud Foundry for deploying apps, one might expect that all the test suites will run painlessly, and what works in development/testing/staging will work in production. However, what if it won’t? What if it is impossible to replicate those conditions in a non-production environment? Here, remote debugging comes to the rescue.
In this blog post, we provide guidelines on how to remotely debug Ruby and Java applications deployed with Cloud Foundry.
General considerations
Remote debugging implies connecting to the application server from your local environment and setting up breakpoints, inspecting variables and diagnosing the issue that is hurting the application. This way, you don’t need to SSH into the server itself, just connect your remote debugger and start working on it.
The debugging processes for Java and Ruby apps differ a bit. We’ll start with Java and explain how to get a suitable IP/port combination (to execute a remote debugger), set up an IDE, and get the app server-ready. For a Ruby app, we’ll demonstrate how to set up an IDE, modify a Gemfile and manifest.yml, and use the Pry gem as an alternative to the classical IDE debugger.
Still, there are some things you need to check on:
- Make sure that you have exactly the same code version in your IDE/local box and in your remote server.
- Open the necessary ports in your computer and/or router (see the next section).
- If the remote debug fails, you can always inspect the logs with
cf logs --recentto see what went wrong. - Make sure that you set the number of instances to 1 in your
manifest.yml. If you set it to more than 1, many instances will try to connect to your debugger, which is not possible. - Install OpenSSL in your local box if you still don’t have it.
- Install Cloud Foundry’s CLI tool.
Getting a suitable IP/port combination
In order to execute some remote debuggers, you need to send data from your application server to your computer. This can be a little tricky. Why? It is most likely that you are behind a router and/or firewall.
So firstly, you need to get your public IP address by going to Google and typing in the search box “public ip address.” This will return your public IP address that the application server’s JVM will be connecting to for remote debugging.
Next, you will have to open and forward an external (public) port to your computer LAN IP address and port. It is done by tapping into the configuration of your router or asking the support guys to do it for you.
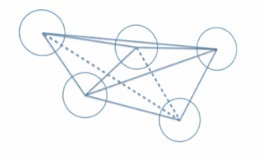
Let’s say, your LAN IP address is 192.168.1.11, and the port that will be listening to connections in your computer is 9571. Assume that your public IP address is 186.201.35.89, and the public port is 29571. First thing to do is port forwarding that will move the packages that the remote application server sends to 186.201.35.89:29571 right to your computer (192.168.1.11:9571). So, the IP/port combination we are going to use for the configuration of the remote application server debugger is 186.201.35.89:29571.
Remotely debugging Java applications
In order to remotely debug Java applications, we need to tell the JVM to establish the connection to the remote debugger and then set up your IDE’s debugger to listen to the connections from the application.
Setting up our IDE
Since one of the most used IDEs out there for Java development is Eclipse, we will use it as a reference. The instructions are very translatable to others, such as NetBeans or JetBrain’s IDEA.
- Open your project in Eclipse.
- Right-click on your project, go to Debug as and pick Debug Configurations.
- Create a new Remote Java Application:
- Make sure your project is selected.
- Choose Standard (Socket Listen) from the Connection Type drop-down menu.
- Now, set a port for the remote debugger to connect to. In our example, it is 9571.
- Click Debug.
Getting our application server-ready
In Cloud Foundry, we do this by modifying the manifest.yml file of the application, adding the env section that will hold the JAVA_OPTS variable with the appropriate instructions.
Let’s say, this is our (very simple) manifest.yml:
---
applications:
- name: my-java-application
  memory: 768M
  instances: 1
  path: my-java-application-1.0.0.BUILD-SNAPSHOT.jar
  buildpack: https://github.com/cloudfoundry/java-buildpack.git
We add the env section and the JAVA_OPTS lines.
---
applications:
- name: my-java-application
  memory: 768M
  instances: 1
  path: my-java-application-1.0.0.BUILD-SNAPSHOT.jar
  buildpack: https://github.com/cloudfoundry/java-buildpack.git
env:
  JAVA_OPTS: -agentlib:jdwp=transport=dt_socket,address=<your-ip>:<your-port>
Surely, you need to change the <your-ip>:<your-port> to the actual values. So, that JAVA_OPTS line will be as follows below.
JAVA_OPTS: -agentlib:jdwp=transport=dt_socket,address=186.201.35.89:29571
To complete this part, just push the changes with cf push. You need the Cloud Foundry CLI to do this.
Now, you will be able to set breakpoints in your code and watch it execute, as well as inspect variables and all the debug features as if they were running in your local box.
Remotely debugging Ruby applications
Remote debugging Ruby applications involves adding a custom start command to the manifest.yml (or running that custom start from the Cloud Foundry CLI), adding a couple of gems to your application, and setting up your IDE.
How to set up an IDE
Since the Eclipse configuration is exactly the same both for Java and Ruby applications (in case you work with Aptana), we are going to set up JetBrain’s RubyMine IDE, one of the most popular Ruby IDEs.
- Open your project in RubyMine.
- Go to the Run Configurations drop-down menu in the toolbar and click on Edit Configurations.
- In the Run/Debug configurations dialog, click on Add New Configuration and select Ruby remote debug:
- Set the name accordingly.
- In Remote Host, put the URL or IP address where the remote debugging is going to happen.
- In Remote Port, type the port of the remote machine where the remote debugger will listen. Make sure this port is open in the server. In our example, let’s set it to 8080.
- In Remote Root Folder, specify the root folder of your application.
- In Local Port, specify the local port that the remote debugger will connect to. In our case, it is 29571.
- In Local Root Folder, click “browse” and find the root folder of your application in the dialog box.
- Copy the line in the “Server command” read-only field in your clipboard.
- Apply the changes and click on the Debug icon in the toolbar.
Modify your Gemfile
Simply add this line to your Gemfile to allow your application to debug remotely to an IDE.
gem ‘ruby-debug-ide’
Modify your manifest.yml or start the remote debugger
You have two options here. The first one is to modify manifest.yml and add the command attribute under the applications section.
Just use the line you copied to your clipboard as shown below.
rdebug-ide -d –host 0.0.0.0 –port 8080 –dispatcher-port 29571 – bin/rails s
So, your (very simple) manifest.yml will look like shown below.
---
applications:
- name: my-rails-app
  instances: 1
  command: “rdebug-ide -d –host 0.0.0.0 –port 8080 –dispatcher-port 29571 – bin/rails s”
Do cf push and you are ready to start remote debugging.
The other option is to simply run the custom start command from the CLI.
cf push my-rais-app -c “rdebug-ide -d –host 0.0.0.0 –port 8080 –dispatcher-port 29571 – bin/rails s”
That is all for debugging Ruby applications. In this case, a Rails one. However, if you have a pure and simple Ruby app, replace the bin/rails s part of the command with the file name of your Ruby script.
Using Pry with Cloud Foundry
An alternative to the classical IDE debugger is to use the much beloved Pry gem.
First, you need to include the following line in your application’s Gemfile.
gem 'pry-remote'
Then, in your code, you need to tell Pry to start debugging and connect to the host and port that will listen remotely.
def my_function
  binding.remote_pry(186.201.35.89, 29571)
end
After that, do cf push to deploy and restart the application. When the application hits the binding.remote_pry line, it will start the DRb server in port 9876 (by default, make sure it is open) and wait for client connections.
Next, go to your application root directory and do the following.
pry-remote -s <host> -c
where <host> is the URL or IP address of the remote application server. And there you are—remote debugging your Ruby application with Pry!
Remote debugging can be very useful in some circumstances and, as shown here, it is quite simple to remotely debug applications deployed with Cloud Foundry. Only a couple of changes in some files, cf push, and you are done.
Further reading
- Troubleshooting .NET Apps on Cloud Foundry: Logs, Metrics, and Remote Debugging
- Real-Time Debugging in Production with Bluemix Live Sync


