How to Set Up Predix Analytics Services and Use Them from a Node.js App

Predix Analytics is a set of services that enable developers to use analytics solutions implemented by data scientists from their own apps. In this post, we explain how to get started with the three services required for running Predix analytics: Analytics Catalog, Analytics Runtime, and Analytics User Interface. With the provided instructions, you will be able to set up the services and call the Univariate Anomaly Detection analytic service from a Node.js application.
Prerequisites
To follow the steps of the tutorial, you need:
- A Predix account
- Node.js and npm installed on your system
- The Cloud Foundry CLI
- The UAA CLI (optional; Predix UAA Dashboard should be sufficient for our needs)
Here, I describe the service setup process very briefly. Refer to the Predix documentation for more detail.
Note that analytic services are commonly referenced as “an analytic” in the Predix catalog. In this tutorial, I use “an analytic service” as the equivalent.
Creating and configuring the services
Before setting up the services, you may want to create a new Cloud Foundry space to isolate your application. You can do it by clicking the Create Space button in the Predix console or by using the Cloud Foundry CLI and its cf create-space SPACE_NAME command (replace SPACE_NAME with a name of your choice). To continue working with the Cloud Foundry CLI within the recently created space, run the cf target -s SPACE_NAME command.
Step 1. Setting up UAA
User Account and Authentication (UAA) is a hard dependency of the Predix Analytics services and is needed for authorizing access to all of their functionality (management, execution, and status check).
To set up a UAA service instance, run the cf create-service predix-uaa Tiered uaa -c '{"adminClientSecret":"SECRET"}' command, replacing SECRET with your password.
If you want to create a UAA service instance from the Predix console, click Subscribe on the User Account and Authentication service page and fill out the form. You may leave the Subdomain field empty.
Step 2. Configuring UAA
For working with analytics, we need a separate UAA client with appropriate grants.
A UAA client can be created with the uaac client add -i command. You have to authenticate as an admin client before setting up a new client (see UAAC documentation). Alternatively, you can create a client from a web configuration tool. To do that, click the Configure Service Instance button on your UAA service page and specify the admin client secret key used in Step 1.
Make sure the new client has implicit, client_credentials, password, and authorization_code in authorized grant types. Scope and authorities are to be updated after the creation of the Analytics services.
Create a user to log in to the Analytics UI with the uaac user add USERNAME -p PASSWORD command.
Step 3. Setting up Analytics Catalog
Before creating an Analytics Catalog service instance, you need to know your UAA GUID. You can obtain it by running the cf service uaa --guid command, where uaa is your UAA service name.
To create the service instance, run the following command,
1 | cf create-service predix-analytics-catalog Bronze SERVICE_NAME -c '{"trustedIssuerIds":["ISSUER_ID"]}' |
where:
ISSUER_IDishttps://GUID.predix-uaa.run.aws-usw02-pr.ice.predix.io/oauth/token.GUIDis the UAA GUID we obtained at the beginning of this step.SERVICE_NAMEis the name you want to give your Catalog service.
After the service is created, you need to update the UAA client and create a group for granting authorities to the client users. First, add analytics.zones.GUID.user to your client’s scope and authorities fields: uaac client update CLIENT_NAME -i. (Ensure you preserve existing values when making the updates.) Then, create the group with the analytics.zones.GUID.user name: group add GROUP_NAME. To grant a user Analytics Catalog access rights, add this user to the group with the uaac member add GROUP_NAME USER_NAME command.
Step 4. Setting up Analytics Runtime
The process of creating an Analytics Runtime service instance is identical to the described in Step 3. Just remember to use predix-analytics-runtime instead of predix-analytics-catalog when launching the instance with the Cloud Foundry CLI and to use the Analytics Runtime service instance GUID in UAA client updates.
Step 5. Setting up Analytics User Interface
You can create an Analytics UI service instance with the following command:
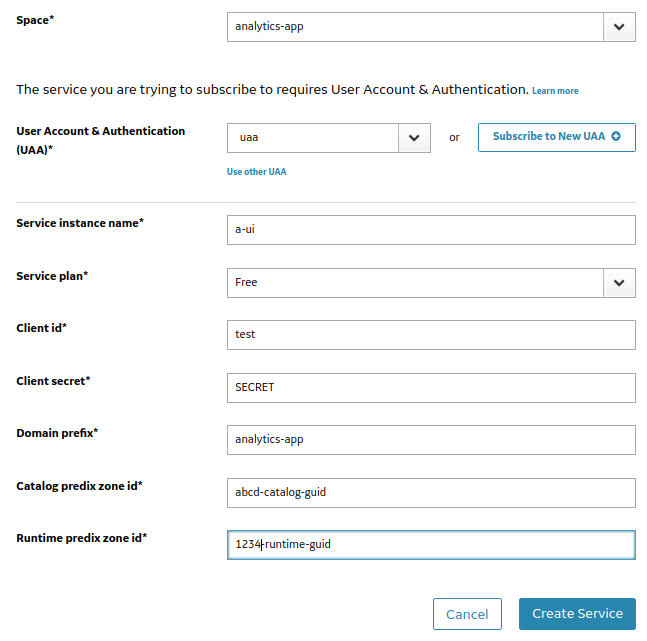
1 | cf create-service predix-analytics-ui Free UI_SERVICE_NAME -c '{"clientId":"CLIENT","clientSecret":"SECRET","uaaHostUri":"UAA_URL","domainPrefix":"YOUR_PREFIX","catalogPredixZoneId":"CATALOG_GUID","runtimePredixZoneId":"RUNTIME_GUID"}' |
Also, the parameters description is available in the Predix catalog (Analytics User Interface in the Analytics Services section), and you can create the service instance right from there.
Now, you should be able to log in to your UI with the user credentials created in Step 1. (You can get the URL from the output of the cf service UI_SERVICE_NAME command.)
Step 6. Setting up the Univariate Anomaly Detection service
In the Predix catalog, go to the Analytics tab, select the Univariate Anomaly Detection analytic service, and then click Subscribe. Fill out the form with information about your space and the services created in the previous steps.
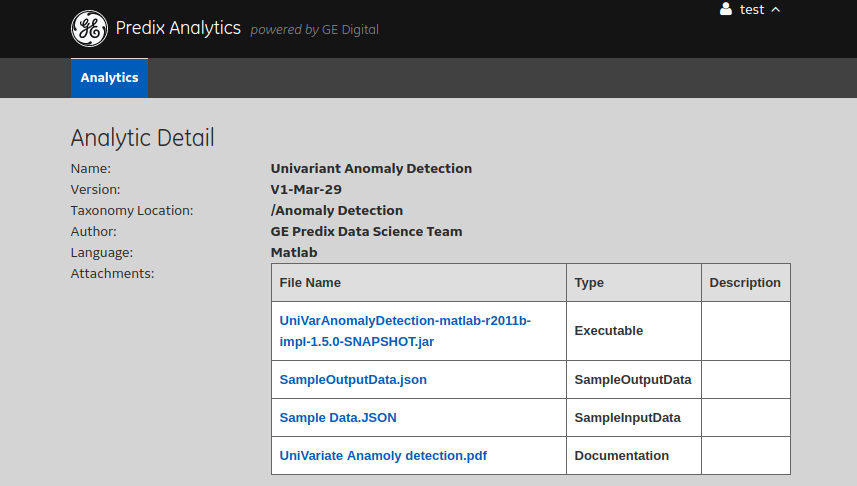
You should be able to see Univariant Anomaly Detection in your Analytics UI. You can obtain the analytic service ID from the last part of its page URL in Analytics UI:
1 | https://YOUR_PREFIX.predix-analytics-ui.run.aws-usw02-pr.ice.predix.io/analytics/view/ANALYTIC_ID |
Test the service by providing some data at the Test tab. You can get sample input from the analytic service description section.
Code for the Node.js application
You do not have to keep the front end and back end of your application separate; however, you will need to run some Node.js code, as Analytics API does not support CORS. To perform HTTP requests from the back-end app, the Request library is used here.
To make an analytics request from my Node.js application, I use the following code:
let opts = {
  method: 'POST',
  uri: ANALYTICS_URI,
  body: JSON.stringify(analyticsInput),
  headers: {
    'Authorization': `Bearer ${token.access_token}`,
    'Predix-Zone-Id': ANALYTICS_ZONE,
    'Content-Type': 'application/json'
  }
}
request(opts, function(err, response, body) {
  if (!err) {
    const respData = JSON.parse(body);
    // respData contains analytics response here
    // ...
  }
});
Here,
analyticsInputis input data for the analytic service. For Univariate Anomaly Detection, it should be in the{"Time":[], "Value":[]}format.ANALYTICS_URIishttps://predix-analytics-catalog-release.run.aws-usw02-pr.ice.predix.io/api/v1/catalog/analytics/ANALYTIC_ID/execution.ANALYTIC_IDis obtained as described in Step 6.ANALYTICS_ZONEis your Analytics Catalog GUID.
The token for a client/user that has Analytics Catalog and Runtime permissions is used to authenticate the UAA request.
Below is an example of how to obtain a client token:
const AUTH_URL = `${UAA_BASE_URL}/oauth/token?grant_type=client_credentials&client_id=${UAA_CLIENT}&client_secret=${UAA_SECRET}`;
request
  .get(AUTH_URL, function(err, response, body) {
    if (!err) {
      const token = JSON.parse(body);
      // token is obtained now
      // ...
    }
  })
  .auth(UAA_CLIENT, UAA_SECRET);
In this code,
UAA_BASE_URLis your UAA instance scheme and hostname.UAA_CLIENTandUAA_SECRETare the ID and secret key of the UAA client.
You can easily wrap these lines in Expess (for HTTP), Socket.IO (for WebSockets), or any other server similar to the following (Socket.IO is used in the example):
const Server = require('socket.io');
const server = new Server().attach(PORT);
server.on('connection', (socket) => {
  socket.on('analyze', (inputData, callback) => {
    // preprocess inputData
    // UAA and Analytics requests {
      callback({success: true, result: result});
      // or callback({success: false, error: error});
    // }
  });
});
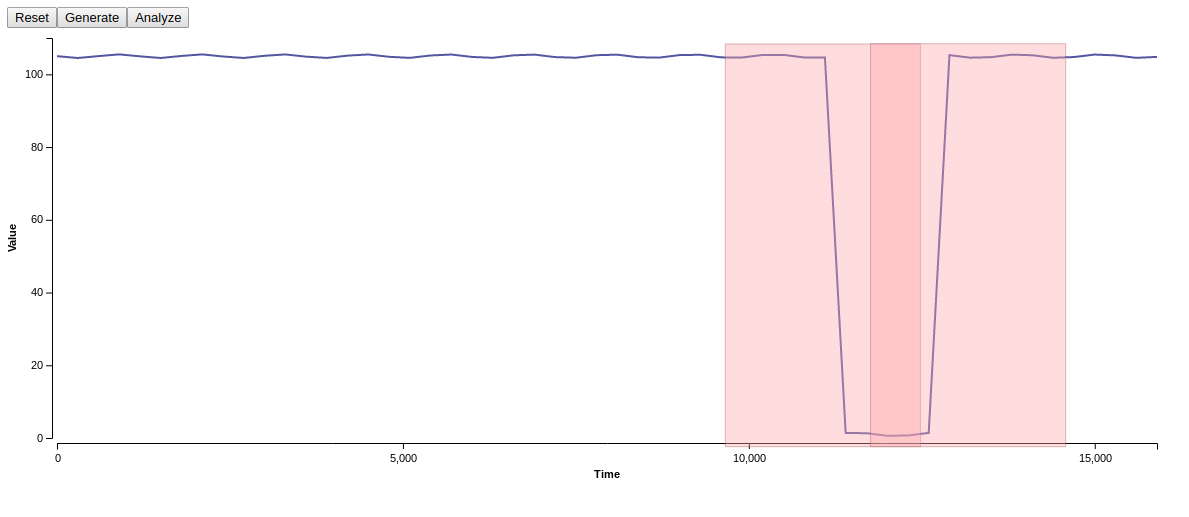
All code of the sample application is available at my GitHub Gist. Environment variables (see 10 top lines) should be used for its proper work. The front-end part of the application looks like this:
What to do next
There are several possible ways to proceed with exploring Predix Analytics. You can start with browsing the Predix analytics catalog, which is currently growing, for analytics services documentation and usage examples. In the Analytics Catalog API documentation, you can also find endpoints for asynchronous analytics calls as well as for creating, maintaining, and structuring your own analytics.
Further reading
- Prototyping a Greenhouse Management System with Node-RED and Predix in 48 Hours
- Introducing a One-Click Button for Deploying to GE Predix
- IoT Prototype: Light Monitoring with NodeRED Components in Predix


