GitLab Autoscales with Kubernetes and Monitors 2.8M Samples per Second
The need for automation
Since 2013, GitLab followed a release cycle where monthly releases were deployed on the 22nd. To help facilitate this cycle, a rotating release manager role was assigned to one of the developers. The release manager would then be responsible for several manual tasks, such as tagging release versions, pushing the release publicly, writing a blog post, and so on.
Release managers iterated on the cycle, creating a knowledge base and automating some of the process. Over time, as the GitLab team and community grew, the accumulation of manual tasks made the current cycle inefficient, and the monthly release for December 22, 2017, was almost missed.
This resulted in the formation of a delivery team led by Marin Jankovski, then Engineering Manager at GitLab. During the Commit Brooklyn 2019 conference, Marin explained how they were tasked with improving the organization’s release cycle with automation and also an eventual migration to Kubernetes.
To get a better idea of the current process, the delivery team collected data over the 14-day period prior to a monthly release.
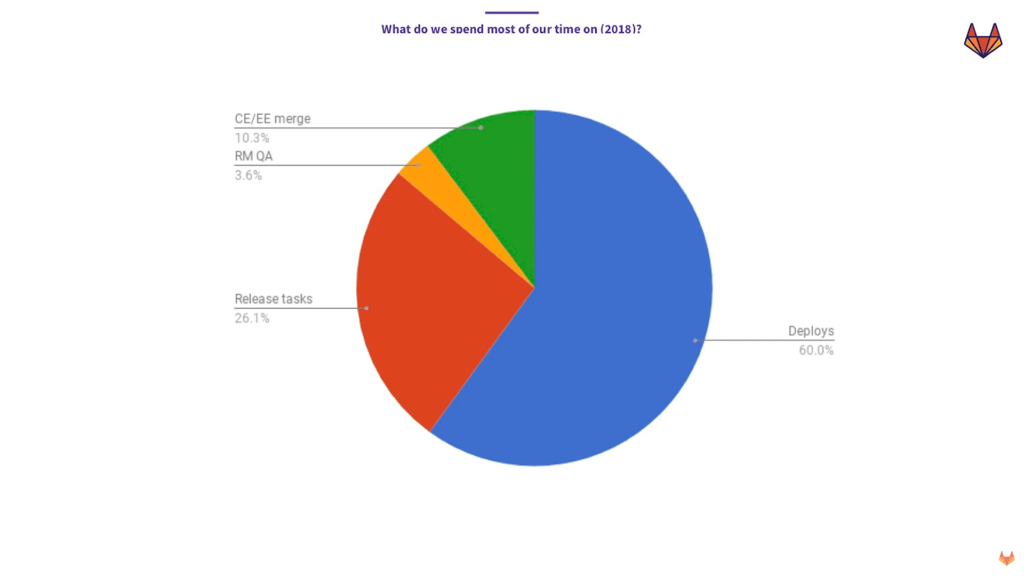 Too many manual tasks (Image credit)
“My team spent 60% of their time in the 14-day period babysitting deploys. Then, 26% of our time was spent on manual or semimanual tasks, such as writing a blog post, communicating the changes between people, and doing various cherry picks for priority one problems.”
—Marin Jankovski, GitLab
By automating release tasks and deploys, the delivery team strived for preventing delays, as well as enabling repeatable and faster deploys with no downtime. Building up mature CI/CD pipelines was also a necessary step to derive maximum value from an upcoming Kubernetes adoption.
Preparing for Kubernetes
To enable automation, the delivery team used existing tools within GitLab to build a continuous integration and continuous delivery (CI/CD) system. In this manner, the organization benefited in two ways:
- Application weaknesses were exposed and stabilized through automation with CI.
- The shift to a CD mindset led to a cultural shift among engineers.
By August 2019, GitLab had fully adopted a CI/CD system that automated 90% of the release process. This led to a faster rate of deployments per month. In addition, having a CI/CD system in place enabled GitLab to take advantage of Kubernetes features, such as rolling updates, health checks, etc.
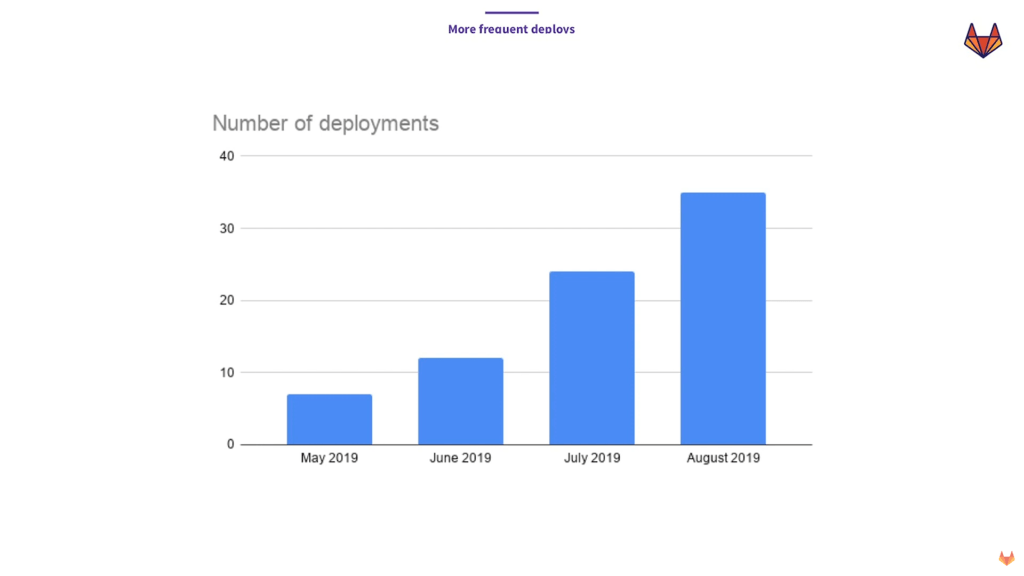 One deploy per day with CI/CD (Image credit)
“In August 2019, we had 35 deploys in GitLab.com. That means more than one deploy a day. None of this is in Kubernetes [yet]. All of this is using our legacy system. But what happened with this is we bought ourselves time, so my team actually has time to work on the migration.” —Marin Jankovski, GitLab
With the automation of manual tasks related to deployment, the delivery team shifted their focus on a different problem—infrastructure scaling.
Since its founding, GitLab has run its servers in the cloud on virtual machines (VMs). With consistent growth, the organization needs to be able to scale on demand. While it is possible to enable autoscaling of VMs, it requires writing additional tooling, and even then the response time may vary from minutes to hours.
So, GitLab expected to dynamically scale the infrastructure on demand within minutes thanks to Kubernetes adoption. When the demand is high, Kubernetes automatically scales up the infrastructure. On the other hand, when the demand is low, the infrastructure is scaled down to reduce costs.
The initial migration
To start off the move to Kubernetes, GitLab first migrated the Container Registry service. According to a blog post by John Jarvis, Staff Site Reliability Engineer at GitLab, while Container Registry was a critical, high-traffic service, it was an ideal candidate for the migration, because it was a stateless application with few external dependencies.
While migrating Container Registry, the GitLab team experienced a large number of evicted pods due to memory constraints on the Kubernetes nodes. To fix the issue, they made multiple changes to requests and limits.
“We found that with an application that increases its memory utilization over time, low requests and a generous hard limit on utilization was a recipe for node saturation and a high rate of evictions. To adjust for this, we eventually decided to use higher requests and a lower limit which took pressure off of the nodes and allowed pods to be recycled without putting too much pressure on the node.”
—John Jarvis, GitLab
Learning from the experience, GitLab started other Kubernetes migrations with high requests and limits that were close in value and adjust as needed.
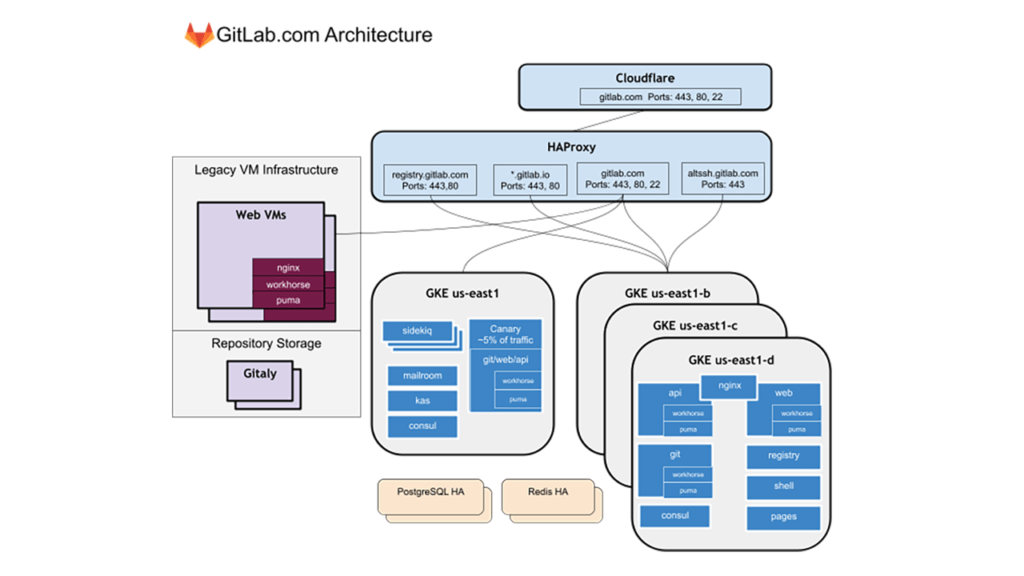 A Kubernetes production architecture at GitLab (Image credit)
Fast forward to September 2020, all application traffic on GitLab.com was serviced by a single Google Kubernetes Engine (GKE) cluster. While the migration was still ongoing, the organization simplified the process by prioritizing services that were stateless and ready to run in a cloud-native environment. Additionally, new services were all deployed to Kubernetes.
“After transitioning each service, we enjoyed many benefits of using Kubernetes in production, including much faster and safer deploys of the application, scaling, and more efficient resource allocation.” —John Jarvis, GitLab
After a successful initial Kubernetes migration, GitLab encountered a different challenge. The company then had to improve its monitoring to keep up with the growth of applications that were all generating metrics.
Monitoring at scale
In 2017, prior to GitLab’s adoption of a CI/CD system and migration to Kubernetes, the company used a single Prometheus server per environment to monitor their deployment. At the time, the organization’s monitoring solution ingested 100,000 samples per second. Additionally, there were 24 alerting rules and 10 recording rules for GitLab.com, 250,000 series combinations, and 21 Grafana dashboards. Over time, these values grew significantly, putting a strain on the company’s monitoring solution.
During KubeCon Europe 2021, Andrew Newdigate, Distinguished Engineer at GitLab, explained that the company started experiencing various problems with their monitoring, including:
- An increase in low precision alerts led to plenty of false positives and few actionable ones.
- Issues that impacted end users were not being detected on time.
- Grafana dashboards kept breaking and would render as empty.
The company realized that the problems stemmed from having three distinct configurations for their monitoring solution.
“The source of metrics was independent from alerting and recording rules. Our alerting and recording rules were managed independently from our dashboards. Our dashboards were not stored in Git, did not have any form of change control, and were not being validated.” —Andrew Newdigate, GitLab
To resolve the issues mentioned above, the GitLab team created a common set of key metrics. Each service in the application was then monitored against those, generating uniform metrics. Next, to improve precision, multi-window and multi-burn-rate alerts were set up. Then, to create a single configuration for alerts and dashboards, the organization wrote a metrics catalog, a JSON file that defines all the metrics. The metrics catalog was stored in Git, changes were managed through merge requests, and CI validated the commits. To generate dashboards using the metrics catalog, GitLab relied on Grafonnet, a Jsonnet library for writing Grafana dashboards.
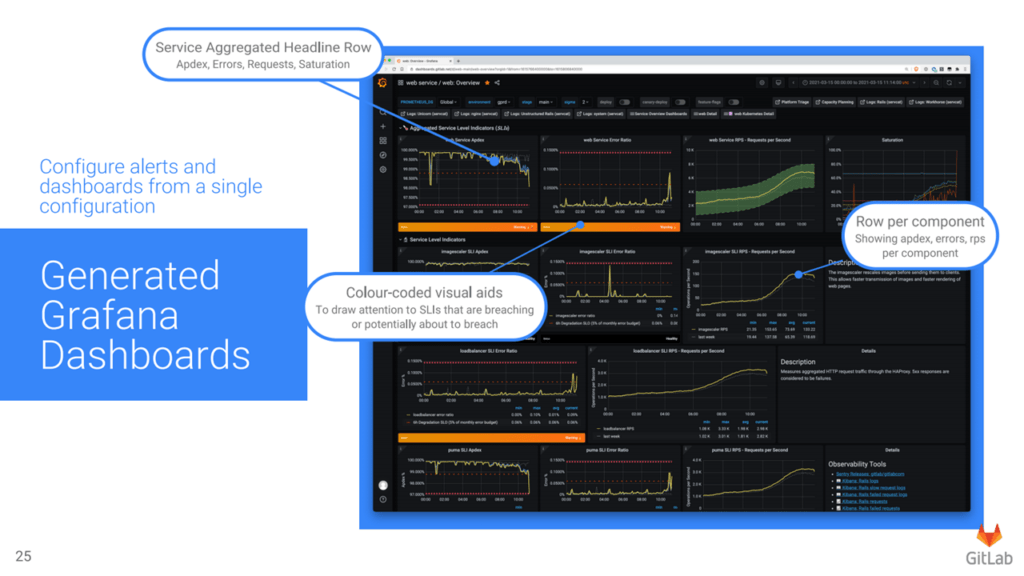 Grafana dashboards generated by Grafonnet (Image credit)
Finally, to enable the monitoring solution to scale with the hybrid virtual machine and Kubernetes deployment, the GitLab team relied on Thanos that delivers an aggregated view across multiple Prometheus instances.
“Thanos provides a single view across multiple Prometheus instances. It also has a component called Thanos Rule, which can be used for evaluating recording rules against a single view. Thanos Rule will also evaluate alerts using the same approach as Prometheus, except it evaluates in a single global view.” —Andrew Newdigate, GitLab
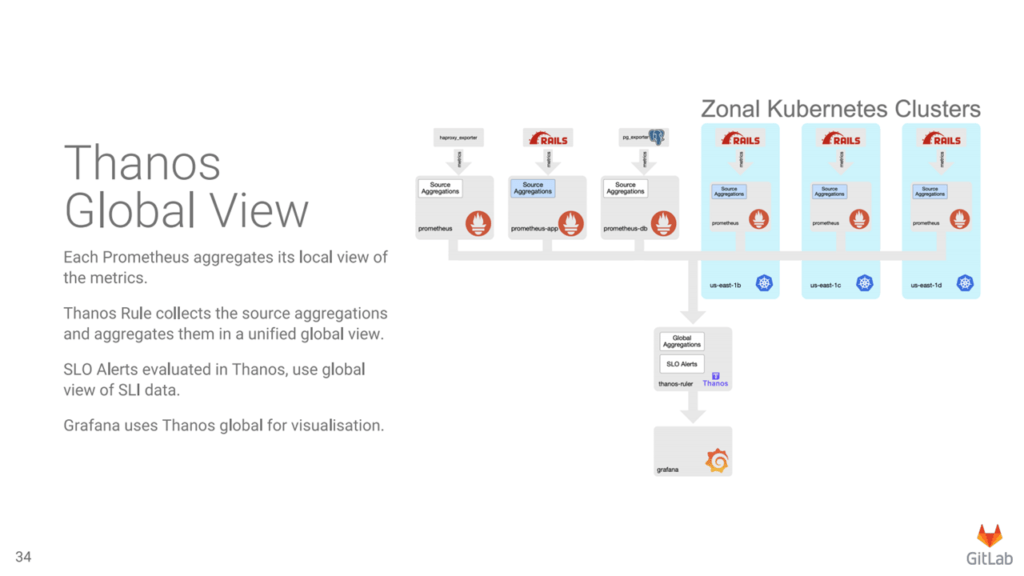 Monitoring with Thanos (Image credit)
As of April 2021, the GitLab now runs Thanos and multiple Prometheus servers per environment. The monitoring solution ingests 2.8 million samples per second. There are now 610 alerting rules and 2,652 recording rules for GitLab.com, 31 million series combinations, and 400 Grafana dashboards.
The Kubernetes migration is still ongoing, and progress can be followed in GitLab’s tracker.
Want details? Watch the videos!
In this video, Marin Jankovski talks about GitLab’s transition to continuous delivery in preparation for a migration to Kubernetes.
In this next video, Andrew Newdigate explains how the company deals with metrics after the migration.
Further reading
- GitHub Crafts 10+ Custom Kubernetes Controllers to Refine Provisioning
- LinkedIn Aims to Deploy Thousands of Hadoop Servers on Kubernetes
- Adobe Migrates 5,500+ Services to Kubernetes
About the experts

Marin Jankovski is Director of Infrastructure at GitLab. He is an experienced leader with a proven history of working in the information technology and services industry. Marin is highly skilled in leading large-scale projects and establishing processes to grow and mature an organization. Previously, he was the primary engineering manager for the delivery team that enabled GitLab Engineering to deliver features in a safe, scalable, and efficient manner.

Andrew Newdigate is Distinguished Engineer at GitLab. He is an expert in multiple technology domains within the company and represents the senior technical leadership within GitLab. Andrew is responsible for helping shape the future direction of the organization, assisting management in establishing strategic roadmaps and driving priorities to meet objectives. He has a strong track record of growing and influencing others, working with all levels of senior leadership, as well as fostering the psychological safety and happiness of team members.

John Jarvis is Staff Site Reliability Engineer at GitLab. He is responsible for maintaining Kubernets workload configurations for GitLab.com. John also keeps user-facing services and other GitLab production systems running smoothly.


