How to Use Elastic Services for Anomaly Detection on IBM Bluemix
This post explains how to use the ELK services—Elasticsearch, Logstash, and Kibana—to detect anomalies in an application. Additionally, we integrate Watcher to send an e-mail when an anomaly happens.
Scenario
To build an application, we use Cuba, a Ruby microframework for web development. The application has the /health-check endpoint that returns HTTP 200 in 80% of cases and HTTP 500 in the other 20% of cases.
There is also a button on the index page that alters the /health-check endpoint returning the HTTP 500 message in 70% of cases and slows down the response time in the other 30% of requests. Then, after 10 requests, the endpoint returns to its original behavior.
Logstash sends a request to /health-check and saves the response data (time, status code, and so on) in Elasticsearch. Kibana reads the saved data in Elasticsearch; you can search and browse your data interactively as well as create and view custom dashboards. Watcher is configured to periodically run an Elasticsearch query, and if a condition is evaluated as true, it should send out an e-mail notification.
Installing the ELK services and Watcher
Elasticsearch
“Elasticsearch is a highly scalable open-source full-text search and analytics engine. It allows you to store, search, and analyze big volumes of data quickly and in near real time. It is generally used as the underlying engine/technology that powers applications that have complex search features and requirements.” —Source: elastic.co
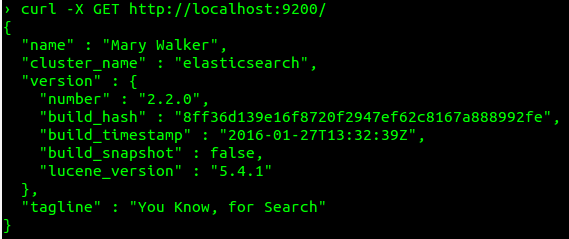
To install Elasticsearch, you need to download the package you want. (I’ve chosen the .deb package because I’m working on Ubuntu.) After installing the service, you can run it using the sudo service elasticsearch start command. To verify whether Elasticsearch has been started, type the following command:
1 | curl -X GET http://localhost:9200/ |
Logstash
“Logstash is an open source data collection engine with real-time pipelining capabilities. Logstash can dynamically unify data from disparate sources and normalize the data into destinations of your choice. Cleanse and democratize all your data for diverse advanced downstream analytics and visualization use cases.” —Source: elastic.co
The process of installing Logstash is similar to installing Elasticsearch. You can download the .deb package and run it with the sudo service logstash start command. However, in this case, I choose the .tar.gz package because you can easily select what configuration file is used by Logstash for start.
To test your installation, go to the extracted folder:
1 | cd logstash-{logstash_version} |
Then, execute bin/logstash -e 'input { stdin { } } output { stdout {} }'.
The -e flag enables you to specify a configuration directly from the command line. This pipeline takes input from standard input—stdin—and moves that input to standard output—stdout—in a structured format. Type hello world in the command prompt to see the Logstash response.

Later, I’ll explain how to run the service with the configuration file that we want.
Kibana
“Kibana is an open source analytics and visualization platform designed to work with Elasticsearch. You use Kibana to search, view, and interact with data stored in Elasticsearch indices. You can easily perform advanced data analysis and visualize your data in a variety of charts, tables, and maps.
Kibana makes it easy to understand large volumes of data. Its simple, browser-based interface enables you to quickly create and share dynamic dashboards that display changes to Elasticsearch queries in real time.” —Source: elastic.co
You can download Kibana from the official website. (I chose the .tar.gz package.) Then, in the extracted folder, run bin/kibana. Before starting Kibana, you also need to have an Elasticsearch instance running.
If everything works well, you’ll see the Kibana dashboard at http://localhost:5601.
Watcher
“Watcher is a plugin for Elasticsearch that provides alerting and notification based on changes in your data.” —Source: elastic.co
To start working with Watcher, install the plugin first. When doing so, you need to know where is your directory path to /bin/plugin.
If you’ve installed Elasticsearch from the the .deb package, you need to run the sudo /usr/share/elasticsearch/bin/plugin install elasticsearch/license/latest and sudo /usr/share/elasticsearch/bin/plugin install elasticsearch/watcher/latest commands.
If you’ve installed Elasticsearch from the the .tar.gz package, go to the extracted folder and run the bin/plugin install license and bin/plugin install watcher commands.
When you get a warning requesting additional permissions, keep in mind that Watcher needs these permissions to set the threat context loader during installation so it can send e-mail notifications.
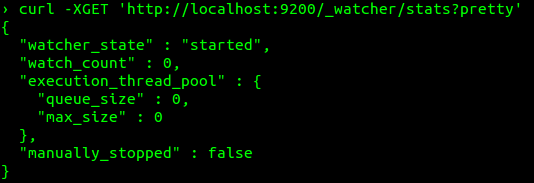
To verify the installation, execute the following command:
1 | curl -XGET 'http://localhost:9200/_watcher/stats?pretty' |
Configuring the services
Logstash
You need to create a configuration file that specifies what plugins you want to use and settings for each plugin. The file has a separate section for each type of plugin you add to the event processing pipeline. For example:
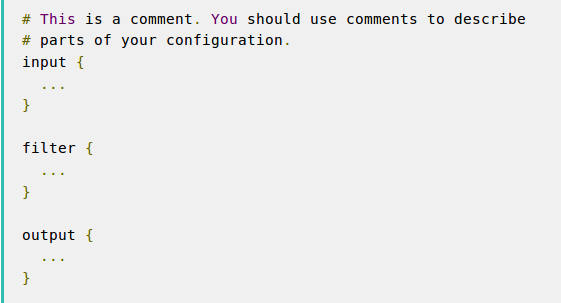
You use inputs to get data into Logstash (for example, data from a file, syslog, or endpoints). Filters are intermediary processing devices in the Logstash pipeline (for example, for JSON, CSV, or Elasticsearch). Outputs are the final phase of the Logstash pipeline that informs Logstash about where to save the output (for example, to a file, stdout, or Elasticsearch).
You can find more examples and documentation about Logstash on the Elastic website.
When configuring Logstash, we use http_poller, a Logstash input plugin that “allows you to call an HTTP API, decode the output of it into event(s), and send them on their merry way”, and elasticsearch as an output plugin. I used a basic configuration for both plugins to read the data from the /health-check endpoint and save it in Elasticsearch. You can see the configuration file with comments explaining each line here.
Kibana
The default settings for Kibana are enough for the purpose of the article. I’ll explain the Settings tab of the Kibana server running on http://localhost:5601.
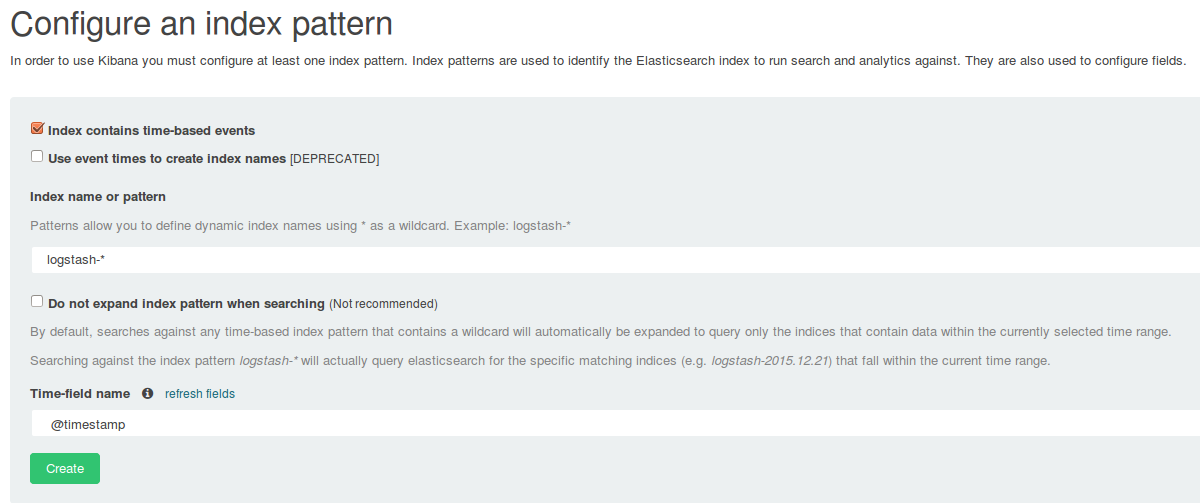
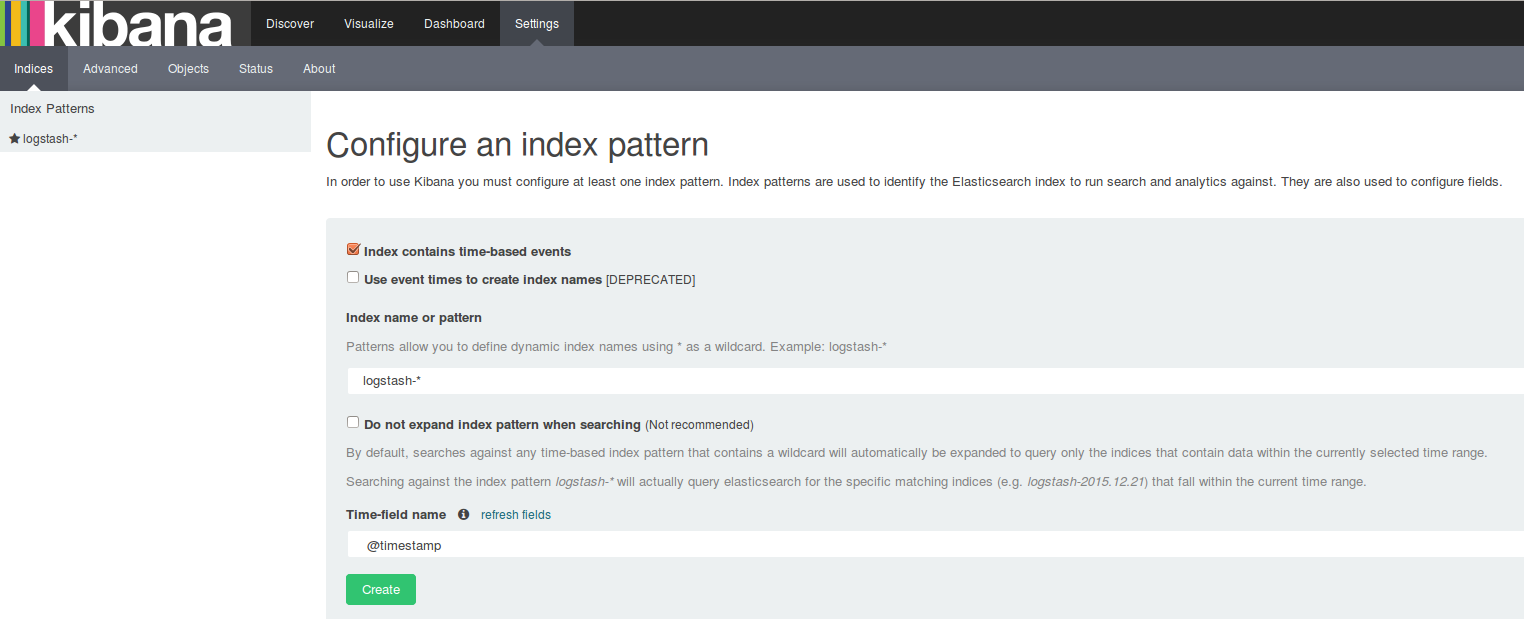
By default, Kibana uses indices saved in Elasticsearch with the logstash-* name. This is the default index name used by the Logstash elasticsearch plugin, so we don’t change anything. Also, we need to specify the field with the timestamp, which is required and used by Kibana for filtering. In this case, it is @timestamp.
Now, we can go to the Discover tab and see all logs saved in Elasticsearch. You can filter the logs, for example, by status with the @status:500 filter. Then you can go to the Visualize tab to choose an option for visualizing your data.
Also, in Kibana, you can see Watcher data saved in Elasticsearch. Enter .watch_history* as an index name on the settings page and then select trigger_event.triggered_time in Time_field name.
Watcher
A typical watch consists of four building blocks:
- Trigger. Controls how often a watch is triggered.
- Input. Gets the data that you want to evaluate.
- Condition. Evaluates the data you’ve loaded into the watch and determines if any action is required.
- Actions. Define what to do when the watch condition evaluates to true, such as sending an e-mail, call third-party webhooks, write documents to Elasticsearch or log messages to the standard Elasticsearch log files.
I’ve prepared two configuration files. In the first one, I set the trigger to run my watch every 20 seconds. There is a query in the input for finding all logs with the HTTP status code 500. Then, in the condition block, I check if the query returns two or more statuses with the 500 code. Finally, in the actions, I send an e-mail if the condition is true. The second file has the same configuration, but the query there looks for slow requests.
To send a notification e-mail, modify the Elasticsearch configuration file first. After you find the elasticsearch.yml file (you can see where it is here), you need to add a couple of lines to it. The image below is an example for Gmail.
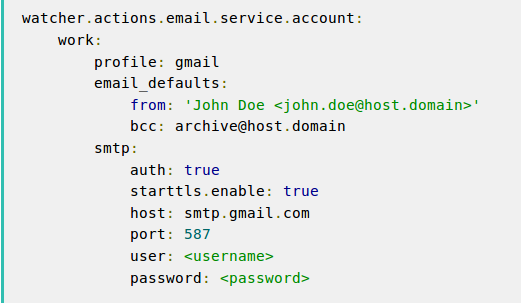
You can find more details about the e-mail configuration here.
To upload the configuration files to Watcher and create the index in Elasticsearch, use these commands: curl -X PUT 'http://localhost:9200/_watcher/watch/500_detection' -d @500_watch and curl -X PUT 'http://localhost:9200/_watcher/watch/slow_requests_detection' -d @slow_requests_watch. The first command creates a new watch with the 500_detection name. (You can choose any name you want.) The -d @ flag tells curl to read the watch file with the 500_watch name for loading the settings.
Running the stack on Bluemix
The first thing you need to do is to clone the repository and log in to Bluemix. You can log in with the cf login command and then run the cf push app-name command. (I use anomaly-detection as the application name.)
In the repository, you’ll see the manifest file with a minimal configuration. I had to select the buildpack because I used Cuba. Cloud Foundry can’t detect what buildpack to choose for this type of applications. Also, I added the command for running the server.
Running the ELK stack
I can deploy Kibana on Bluemix using a service for Elasticsearch and then see data from the application in Kibana. But I have two problems. First, the service used for Elasticsearch (Searchly) doesn’t have the Watcher plugin installed, so I need to run my own Elasticsearch version. Second, for deploying Logstash, I’ve found two posts here and here that explain how to send logs to Bluemix using the Logstash agent, but they aren’t helpful in my case.
So, I’ve decided to use a container and found out that Bluemix supports Docker images already stored in the Docker Hub and adds them to a private registry hosted by IBM. I chose the most popular image for ELK, modified the image, and created a GitHub repository for it.
Now, you can build the image and then use it in Bluemix for creating new containers. To do that, use the IBM Containers plugin for Cloud Foundry. Here are the installation guidelines.
After you install the plugin, you can run the cf ic build -t registry.ng.bluemix.net/NAMESPACE/elk command in the image folder. With the cf ic images command, you can see all images available in Bluemix and the one we created.

To use the image in a new container, you can work with the CLI or the Bluemix dashboard. I’ll use the dashboard. You need to click START CONTAINERS, then you’ll see the image that we’ve pushed. Select the elk image, and you can configure and run a new container using this image.

Add a name for the container and change the size to Small. In the Public IP address, select the Request and Bind Public IP option. Finally, in the Public ports field, specify the port where the stack will run: 5601, 5000, and 9200. When all is configured, click the Create button.
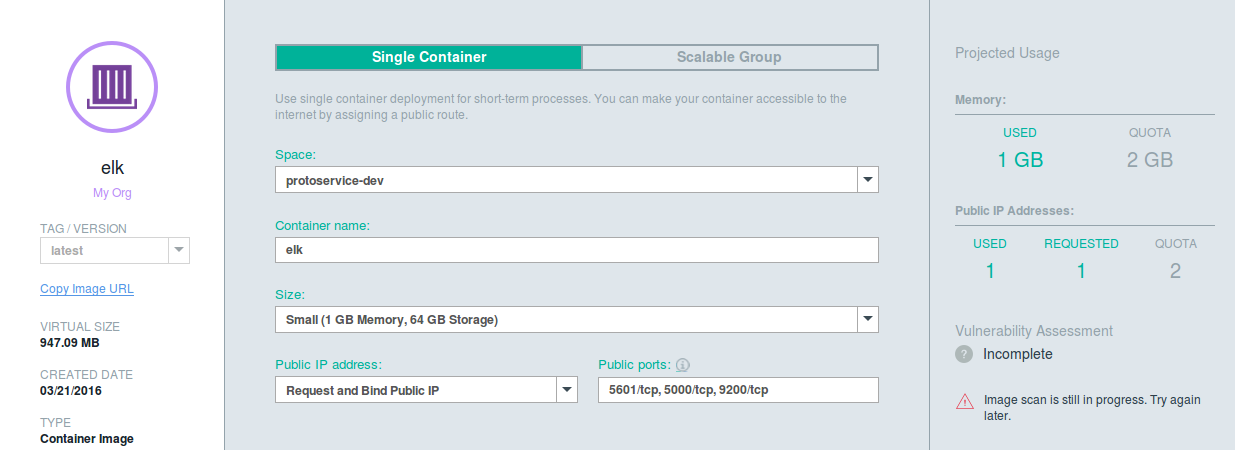
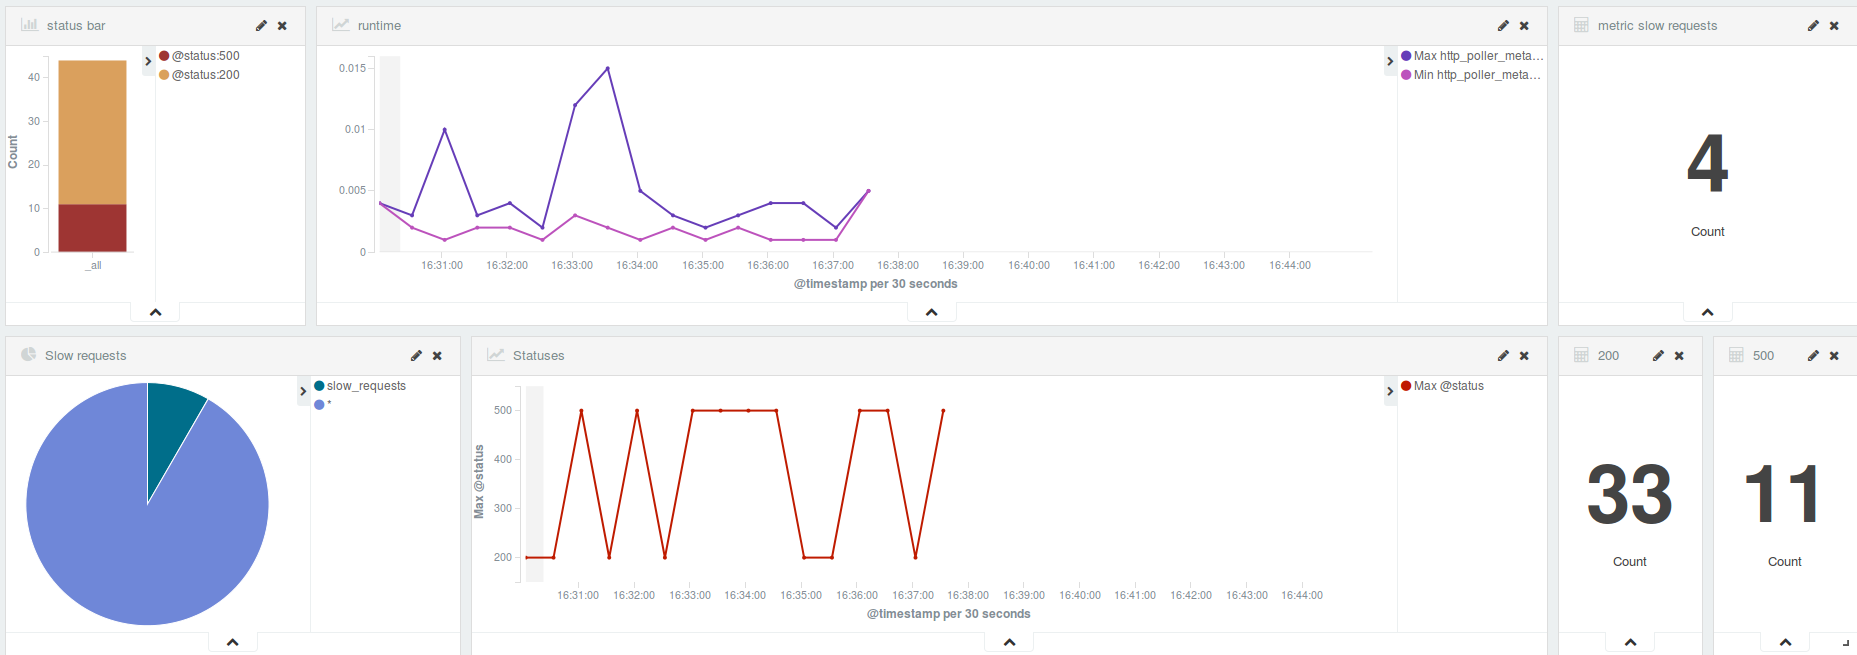
You can go to the IP assigned to the container on port 5601 and see all data in real time. Your data saved by Logstash and Watcher is there. Here is an example of the dashboard showing data saved by Logstash.

Once you have the container running, go to the index page of the application and click the Add Anomaly button to slow down responses (in 30% of cases) or return an HTTP 500 (in 70% of cases) for the next 10 requests. After these 10 requests, the /health-check endpoint returns to its original error rate.
To slow down the response time of requests, I added a sleep before a response. In the Logstash configuration file, I created the slow_requests tag for requests that take more than 0.9 seconds.
Finally, if everything is configured correctly, you’ll start to receive e-mails when an anomaly is detected by Watcher.
Conclusions
If you already have some knowledge about the ELK stack, implementing Watcher is an easy process supported by good documentation.
If you don’t have any knowledge about ELK, you need to spend some time learning about each of the services. Again, all of them have good documentation, and you can find ready configuration for multiple cases.
To deploy the ELK stack and Watcher on Bluemix, you can use integration with Docker. This makes things simpler because you only need to choose an image from the Docker Hub, modify it for your situation, and then build it on Bluemix. Also, the plugin for extending the functionality of the Cloud Foundry command line interface to containers is very helpful.


